Before adding filters, it helps to separate global filters from chart-level filters. Global filters affect the entire dashboard, while local filters only affect one visual. In this tutorial we will use global filters for `Year`, `Month`, `Country`, and `Category`, because they make it easy to explore the same dataset from different angles.
- Prefer fields with a reasonable number of values so the interface stays usable.
- Avoid too much free-text filtering when a dropdown or selector works better.
- Make the filter combination cumulative and recalculate KPI cards and charts automatically.
- If a filter has no selected value, it should behave like `All`, not like a hidden restriction.
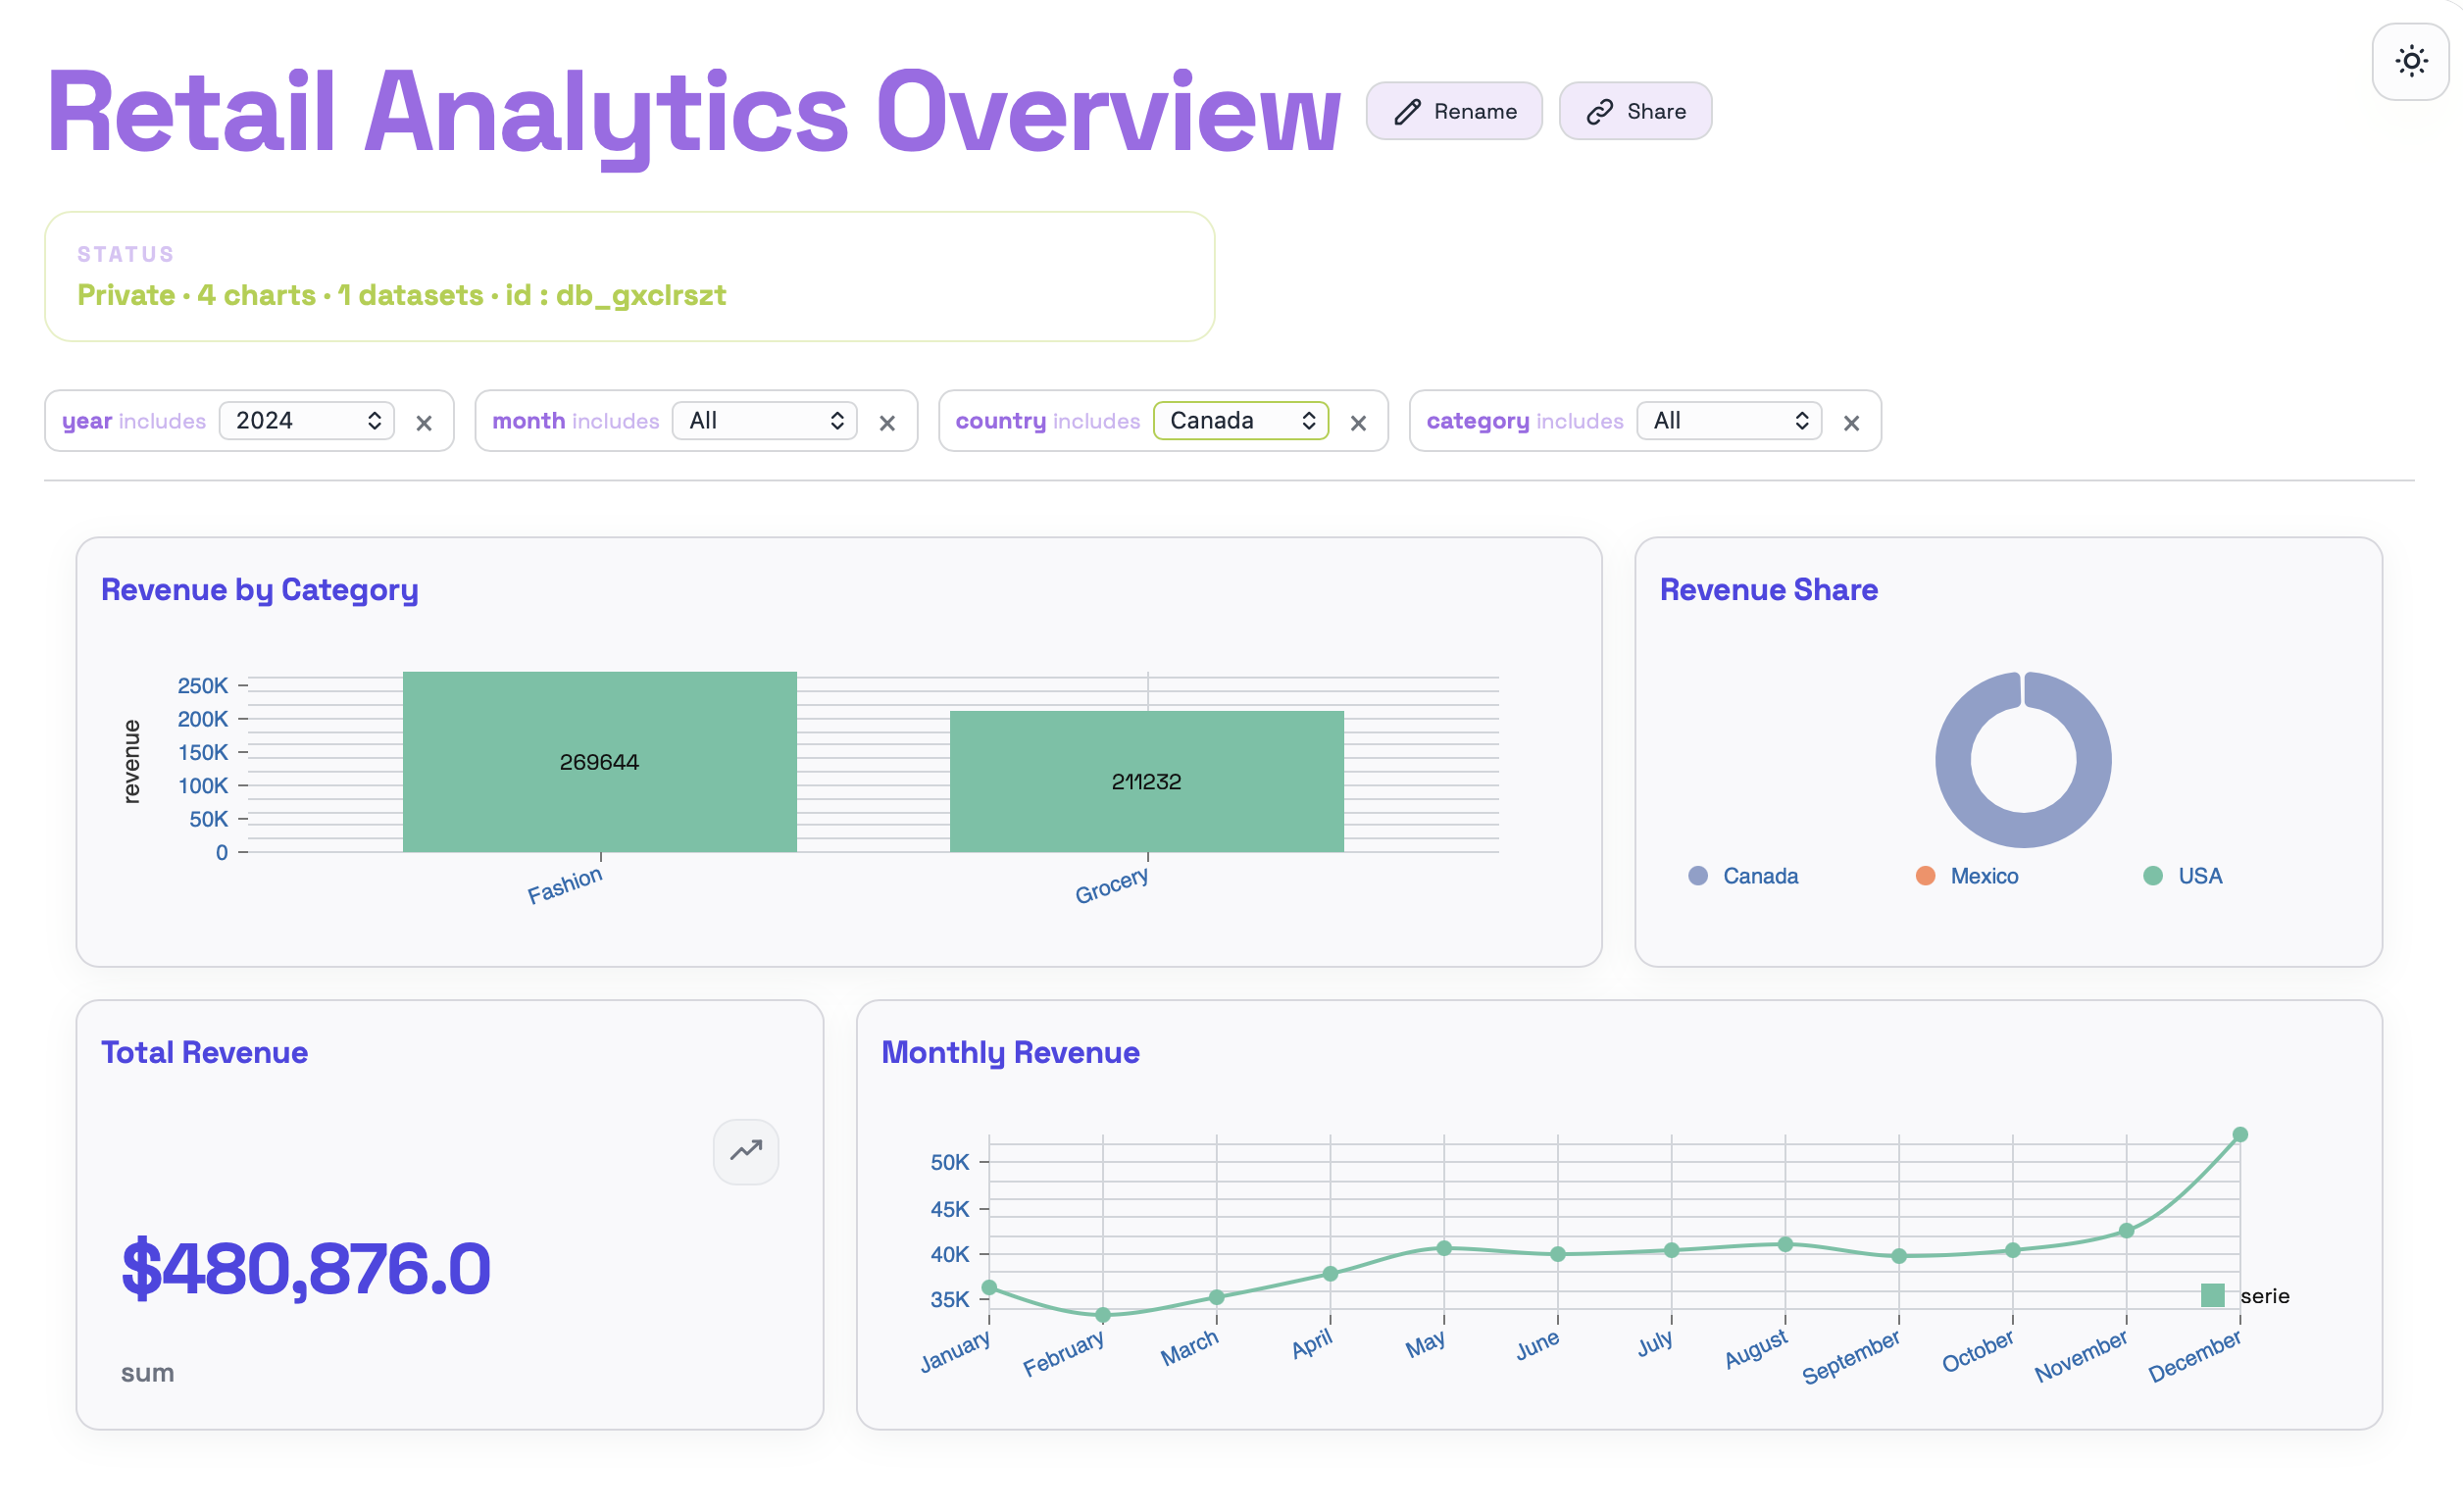
Add global filters to the `Retail Analytics Overview` dashboard for `Year`, `Month`, `Country`, and `Category`. The filters must be combinable in any order and must update and recalculate the values in the other charts.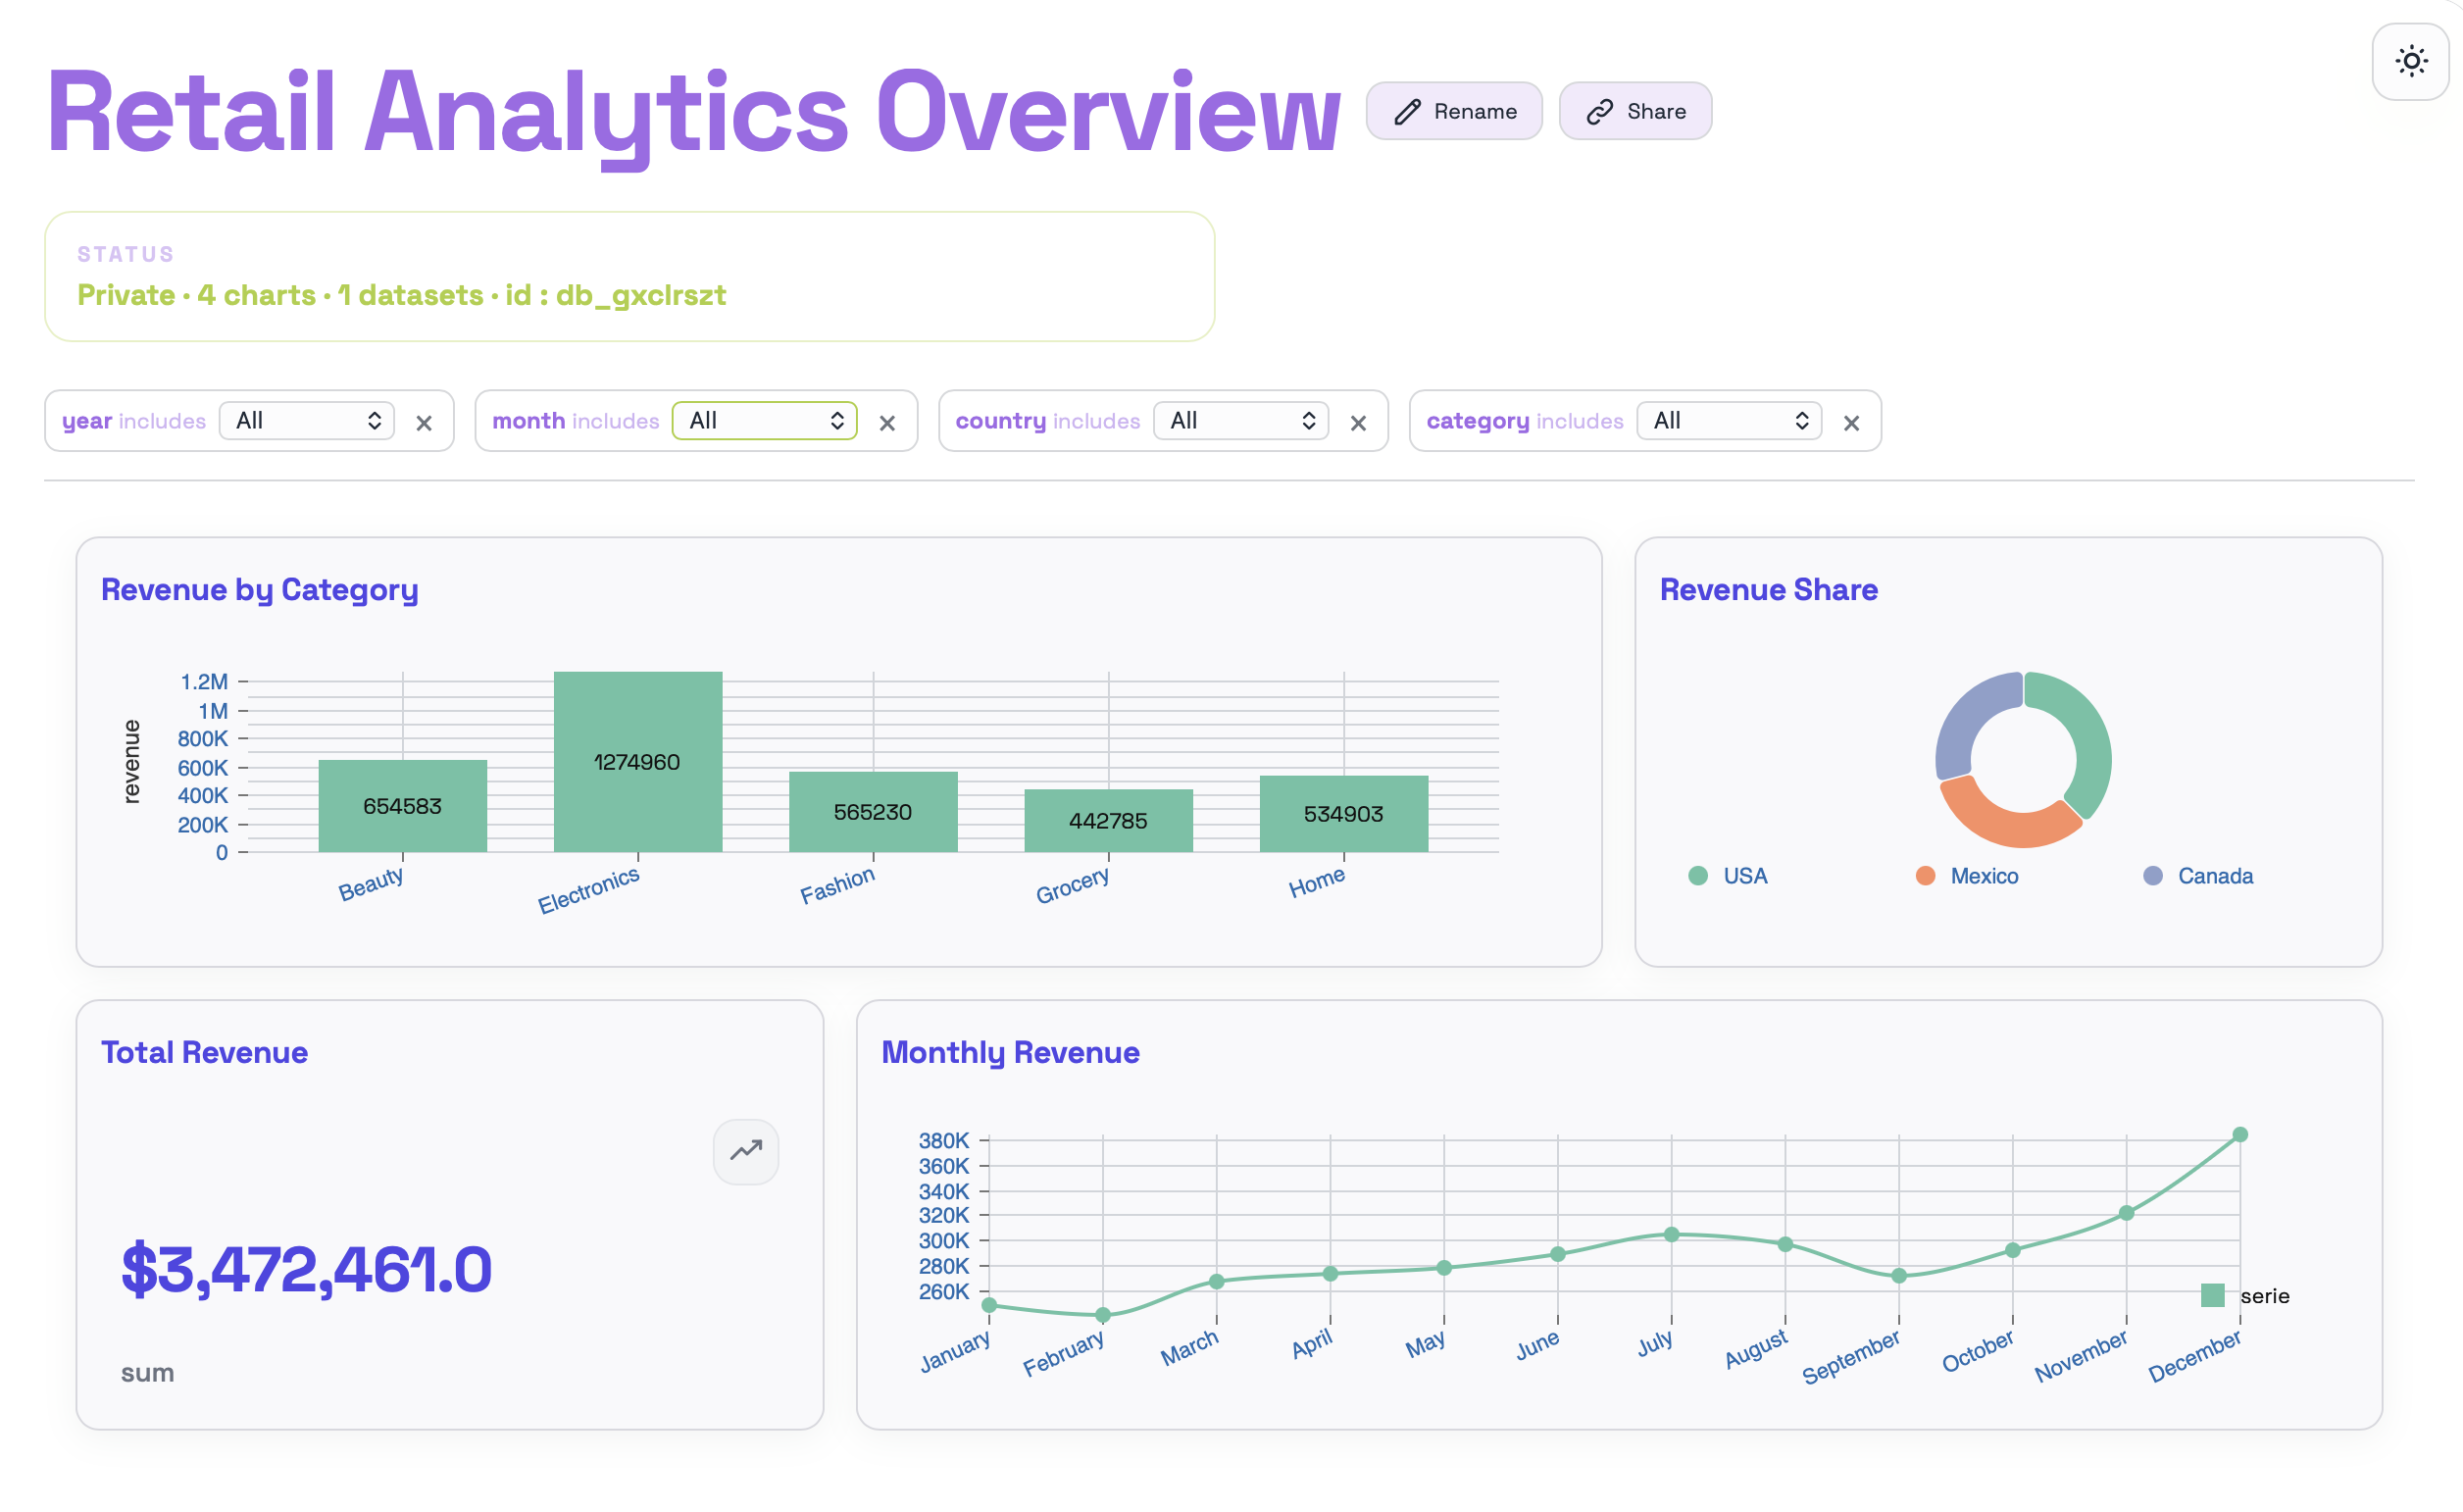
When a combination of filters is selected, the visuals will update accordingly to reflect only the data that matches those conditions.
In the next section we will change the dashboard appearance to improve its visual presentation.